
Background
In recent years, scholars and policymakers have increasingly turned their attention to the connection between economic inequality and social mobility.
One of the most influential frameworks for understanding this relationship is the Gatsby Curve, a concept introduced by American economist Alan Krueger in 2012. The curve illustrates a positive link between a society’s degree of income inequality and the extent to which economic outcomes persist across generations.
Or to put it more simply, “Countries with equality give children a much better chance to succeed”.
This blog examines the nature of the Gatsby Curve and explores how it highlights long-term inequality, stagnating living standards, and diminished economic mobility and how this helped explain the backdrop that made the Brexit referendum possible.
(While the Gatsby Curve is not a direct explanatory mechanism for Brexit, it sheds light on the wider socioeconomic environment in which the Leave vote gained traction).
Understanding the Gatsby Curve
The Gatsby Curve takes its name from F. Scott Fitzgerald’s The Great Gatsby, a novel known for depicting the rigidity of social class in early twentieth-century America.
Krueger’s use of the title was intentional. He sought to emphasise how barriers to upward mobility remain central challenges even in modern market economies.
The curve plots two variables across multiple countries, namely (a) the Gini coefficient (a measure of income inequality) and (b) intergenerational earnings elasticity (a measure of how strongly parents’ earnings predict their children’s earnings).
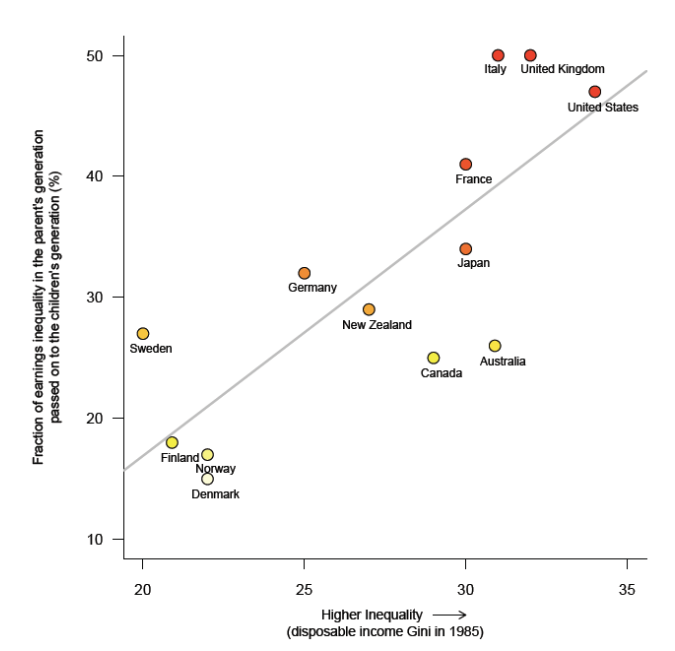
Countries like Denmark, Norway, and Finland tend to appear in the lower-left quadrant of the curve, meaning they have relatively low inequality and relatively high mobility. But by contrast, countries like the United States, Italy, and the United Kingdom have historically registered both high inequality and low mobility, placing them in the upper-right portion of the curve.
The significance of the Gatsby Curve lies in its suggestion that inequalities in income distribution are not merely temporary economic outcomes but are deeply connected to how opportunities are allocated across generations.
This means that if children from poorer families consistently face higher barriers to advancement, then inequality becomes self-reinforcing. Or alternatively, the wealthy can invest in preserving and re-enforcing their advantages, while the poor struggle to break free of structural constraints.
This process can create a sense of economic stagnation, hopelessness, and frustration. These conditions were clearly observable in many British communities in the years preceding the Brexit referendum.
The UK’s Position on the Gatsby Curve
The United Kingdom has long displayed many of the economic characteristics that the Gatsby Curve links to low mobility.
From the 1980s onward, wage inequality grew markedly, partly due to the decline of manufacturing, changes in labour market structures, and the rise of high-skilled service sectors concentrated in London and the South East.
While sections of the UK economy thrived, particularly finance, technology, and global trade, many former industrial regions experienced consistent economic decline. The closure of coal mines, steel plants, and shipyards left enduring scars on communities in the North of England, the Midlands, Wales, and parts of Scotland.
This meant that intergenerational mobility also stagnated.
Several studies showed that young people’s economic prospects became increasingly tied to the socioeconomic status of their parents. Home ownership, stable employment, and higher education, once viable pathways to upward mobility, became harder to access.
As a result, the UK developed one of the strongest geographic divides in Europe between areas of economic dynamism and areas of long-term decline.
It is within this social context of uneven opportunity that the Gatsby Curve becomes highly relevant to understanding Brexit.
How the Gatsby Curve Helps Explain Brexit
1. Entrenched Inequality and Social Frustration
One of the key insights offered by the Gatsby Curve is that inequality does not simply create disparities in income; it affects how people perceive their own prospects and those of their children. In many British towns, the belief that social mobility had stalled became a pervasive sentiment by the 2010s. Wages had stagnated, traditional forms of employment had disappeared, and public services had been eroded by austerity measures introduced after the 2008 financial crisis. For many voters, especially older ones, this created a sense of having been economically sidelined.
This frustration aligns directly with the conditions described by the Gatsby Curve. When people feel trapped in a system that offers limited opportunity for advancement, dissatisfaction with political institutions grows. The EU, often portrayed by the Leave campaign as a distant bureaucracy, became a convenient symbol of the status quo. As a result, the Brexit vote functioned not only as a judgment on the EU but also as a protest against decades of economic stagnation and perceived neglect.
2. The Geography of Mobility and the Geography of the Vote
Perhaps the most striking parallel between the Gatsby Curve and the Brexit outcome lies in the geographical distribution of the Leave and Remain votes. Affluent, highly educated, and internationally connected regions such as London, Cambridge, Bristol, and parts of Scotland overwhelmingly voted to remain in the European Union. These areas enjoy higher intergenerational mobility, stronger labour markets, and greater access to well-paid jobs. By contrast, regions that had experienced long-term industrial decline, such as South Wales, the North East, Humberside, and the Black Country, showed strong support for Leave.
This pattern is consistent with a country positioned toward the “high-inequality, low-mobility” end of the Gatsby Curve. Areas where economic opportunity is scarce and mobility is limited are more likely to experience political discontent and to support radical policy changes. Brexit became a vehicle through which these areas voiced their desire for a break with the status quo, even if the EU itself was not the root cause of their grievances.
3. Attitudes Toward Globalisation and Economic Change
The Gatsby Curve also helps explain how attitudes toward globalisation became central to the Brexit debate. Economic theory suggests that when mobility is high, people are more likely to embrace openness, trade, and competition because they believe they can adapt and succeed. But when mobility is low, globalisation can feel threatening rather than empowering.
Many Leave-leaning voters expressed concerns about immigration, competition for jobs, and the perceived loss of economic control. These views should not be understood solely as cultural or nationalist reactions; they reflect deeper anxieties about economic insecurity. If individuals believe that the system is stacked against them and that they lack the means to improve their own condition, then external forces such as immigration or international institutions may seem overwhelming or unfair. The Gatsby Curve framework helps contextualise these fears as symptoms of a broader inequality-mobility problem.
4. Political Narratives and the Mobilisation of Discontent
A final way in which the Gatsby Curve’s insights illuminate Brexit is through the political narratives employed during the referendum campaign. The Leave campaign frequently emphasised themes of economic decline, lack of local investment, and the need to “take back control.” These messages resonated strongly in communities that had suffered from decades of limited mobility and regional inequality. Meanwhile, warnings from economists, businesses, and political elites about the risks of leaving the EU had less impact in these regions precisely because trust in institutions had eroded.
When mobility is low, the legitimacy of traditional power structures is often questioned. The Gatsby Curve helps explain why appeals to expert authority were less persuasive: many voters felt that those in power had failed to address their economic concerns, and thus their advice lost credibility. Brexit, therefore, served both as a statement of dissatisfaction and an experiment in political realignment.
Conclusion
While the Gatsby Curve itself is not a political model and does not directly explain voting behaviour, it offers a valuable lens through which to understand the structural economic conditions that influenced the Brexit referendum.
The UK’s position on the curve, a country with high inequality and limited intergenerational mobility, helped create an environment conducive to political discontent and scepticism about the benefits of globalisation and EU membership.
Communities that felt economically trapped and socially neglected were more inclined to view Brexit as an opportunity to challenge a system that had failed to deliver prosperity or fairness. The Leave vote thus reflected not only attitudes toward Europe but also deeper frustrations rooted in decades of uneven development, stalled mobility, and widening inequality.
In this sense, the Gatsby Curve does not simply help explain Brexit; it reveals the underlying social fractures that continue to shape political life in the United Kingdom.
Understanding these dynamics is essential for crafting policies that address regional inequality, restore social mobility, and rebuild trust in democratic institutions.
Only by confronting the structural realities highlighted by the Gatsby Curve can the UK hope to move beyond the divisions that defined the Brexit era.
Recent Comments